...

OEE Monitoring

Monitor the main Key Performance Indicators of your company through visual management tools

Machine monitoring

Productivity indicator of the production plant

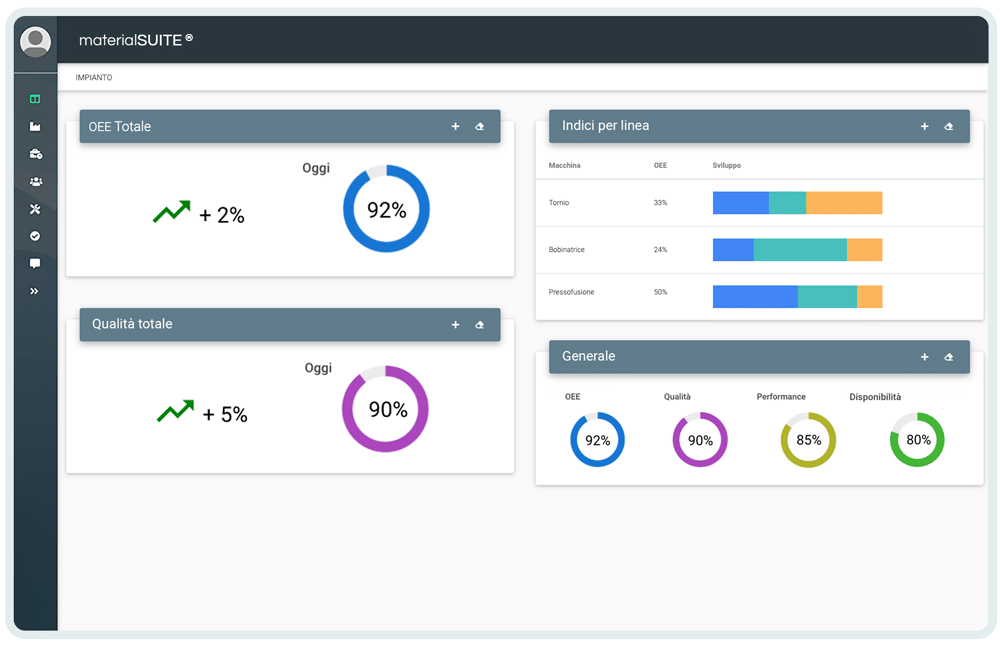
The best way to measure your production performance is to set up an adequate monitoring system.
One of the main indicators of performance within manufacturing industries is certainly the OEE, the Overall Equipement Effectiveness, a KPI that through the analysis of three indices: quality, performance and availability, is able to report the productivity rate of production lines, machines and plants.

dashboard oee kpi
  • Logo freccia

    Configurable indicators on the basis of business processes

  • Logo freccia

    Intuitive, usable and customisable solutions

  • Logo freccia

    More control over production costs

  • Logo freccia

    Vehicle performance real time monitoring

Improve your performance

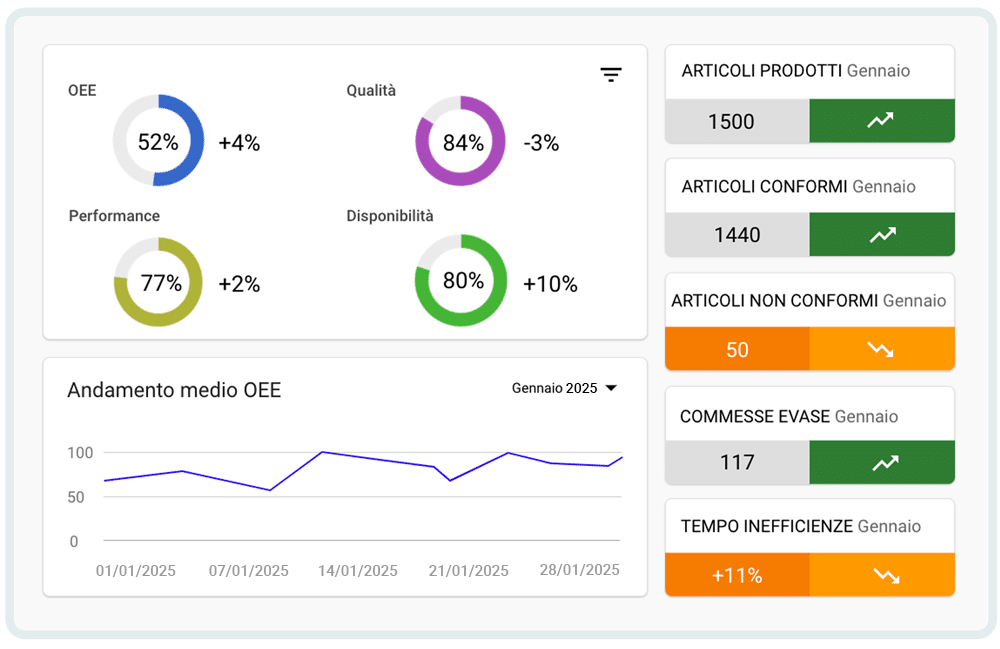
The knowledge and constant monitoring of its OEE allow companies not only to progressively improve their performance, identifying the weaknesses of the processes, but allow to reach better levels of competitiveness and at the same time to reduce costs.
Through visual management solutions, combined with Google Material graphics, it is possible to monitor the performance of the OEE over time, facilitating the identification of critical issues and their resolution.

oee kpi andamento
  • Logo freccia

    Quick criticality detection and real time alert

  • Logo freccia

    Easy and intuitive user interfaces

  • Logo freccia

    Data updated automatically

  • Logo freccia

    Ability to export and manipulate data

What benefits do I get from OEE analysis?

The OEE allows to identify and monitor configurable indicators based on business processes and highlights intuitive, usable and customisable solutions.
The impact generated by the OEE KPI analysis allows, finally, a greater control on the production costs and the rapid identification of criticalities and real time alerts.

FAQ

What is OEE and why is it important to monitor it?

The OEE (Overall Equipment Effectiveness) is the KPI that measures the overall efficiency of a production plant by combining three factors: Availability (% active vs planned machine time), Performance (actual vs theoretical speed), Quality (% good parts vs total products). The OEE reveals how much of the production potential is actually being exploited. An OEE of 60% means that 40% of machine time is lost due to stops, slowdowns and discards. Continuously monitoring it allows you to identify and resolve hidden losses, improving productivity and profitability.

How is OEE calculated and what are the reference values?

OEE is calculated by multiplying the three factors: OEE = Availability × Performance × Quality. Concrete example: Availability 85% (stops 15%), Performance 90% (slowdowns 10%), Quality 95% (waste 5%), then OEE = 0.85 × 0.90 × 0.95 = 72.6%. The reference values are: <60% critical (large losses), 60-75% acceptable (room for improvement), 75-85% good (process under control), >85% excellent (world-class). A 100% OEE is theoretical and practically impossible.

OEE Software: How Does Automatic Monitoring Work?

Automatic OEE software connects directly to machines via PLCs, IoT sensors, or 4.0 connections to detect: machine status (in production, shutdown, setup, failure), machine counter part count, actual production speed, scrap, and rework. The software calculates OEE in real time without manual intervention, displays visual dashboards on department monitors, sends automatic alerts when OEE drops below thresholds, generates daily/weekly reports with Pareto analysis of stops. All plotted 24/7 eliminating imprecise or incomplete manual annotations.

Difference between OEE and OLE (Overall Labor Effectiveness)?

OEE measures the efficiency of automatic plants/machines, while OLE measures the efficiency of human labor (operators, manual assembly). The OLE considers: Operator Availability (% production time vs planned attendance), Operator Performance (actual vs standard pieces/hours), Quality (% good pieces vs operator totals). In companies with a strong manual component (assembly, packaging), OLE is as crucial as OEE. Monitoring them together allows you to balance investments in automation vs. training and human work organization.

How much does an OEE monitoring system cost?

Costs vary by type of solution. L’ typical initial investment for 5-10 machines: 10,000-25,000€ plus 200-600€/month of rent. For more complex systems with predictive analytics and AI: 30,000-80,000€. The economic benefits come from: unplanned firm reduction (5-15%), increased production speed (10-20%), reduction of discards (5-10%). Typical ROI: 12-24 months.

How to improve OEE after measuring it?

After measuring OEE, take targeted action: to increase Availability, implement data-driven preventative maintenance, reduce SMED setup times, and eliminate frequent micro-stops; to improve Performance, identify and remove bottlenecks, optimize machine parameters, and train operators on best practices; to increase Quality, analyze recurring defects with Pareto, implement in-process controls, and review process setups. The best approach is Kaizen continuous improvement with multifunctional teams that analyze OEE data weekly and implement countermeasures.